AI Investment
Charts on where AI money goes: corporate and private investment, generative AI, startups, countries, US states, sectors and company revenue. Global corporate AI investment reached $581.7B in 2025, 2.3 times 2024.
Infrastructure & Industry · 18 charts · 7 topics
- Source
- Stanford AI Index Report 2026
- Charts
- 18 with CSV data
- Last checked
- 21 Oct 2026
- Data
- All CSVs (zip)
$581.7BGlobal corporate AI investment in 2025, up from $253.0B in 2024View chart →$170.9BPrivate investment in generative AI in 2025, up from $50.6B in 2024View chart →3,499AI companies worldwide that raised their first funding in 2025, up 71%View chart →23×US private AI investment ($285.9B) relative to China's ($12.4B), 2025View chart →77%California's share of private AI investment tracked across US states, 2025View chart →$65BAnthropic annualised revenue at the end of July 2026 (Epoch AI estimate)View chart →
Corporate investment in AI more than doubled in 2025. Companies put $581.7B into AI that year, counting private funding, mergers and acquisitions, minority stakes and public offerings: 2.3 times the $253.0B of 2024 and well above the previous high of $360.7B in 2021. Private investment was the largest part, at $344.7B.
Read the full overview
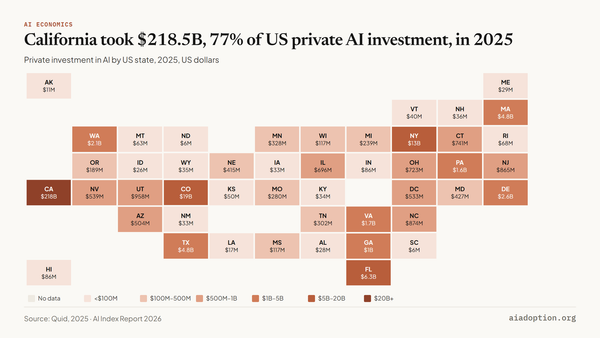
Generative AI drew $170.9B of private investment, about half of the total and 3.4 times its 2024 level. The money is concentrated. US-based AI companies received $285.9B of private investment, 23 times China's $12.4B, and within the US, California took $218.5B, 77% of the amount tracked across states. By focus area, AI infrastructure, models, research and governance drew $143.2B, up from $37.3B in 2024.
More companies are being funded as well. 3,499 AI companies raised their first funding in 2025, up 71% on 2024, even as the number of newly funded generative AI companies fell to 311 from 372. The average private AI deal reached $66.5M. At company level, Epoch AI estimates put Anthropic's annualised revenue at $65B at the end of July 2026 and OpenAI's at $50B at the end of September 2026, while OpenAI's reported compute spend rose to $16.3B in 2025.
The charts cover AI investment trends, generative AI investment, AI startups, AI investment by country, by US state and by sector, and AI company revenue. The figures come from Stanford's AI Index Report 2026, with additional data from Epoch AI on company revenue and compute spend and from Brookings on funding for AI applications. Revenue figures are estimates, and each company's latest point falls on a different date. Country figures assign investment by where a company is based.
AI Adoption · 2026AI Statistics: the pocket guide83Free for subscribersAll 83 key numbers on two pages, with sources.Every hub's headline numbers in one PDF, ready for a board paper or a slide.Get the guide
01
AI Investment Trends
Global corporate investment in AI reached $581.7B in 2025, 2.3 times the $253.0B of 2024, with private investment the largest part at $344.7B. Deals also grew larger: the average private AI investment event was $66.5M, up 46% from $45.5M in 2024 and more than five times its 2013 size.
 AI Investment Trends$581.7BGlobal corporate AI investment in 2025, up from $253.0B in 2024Corporate AI investment more than doubled to $581.7B in 2025Chart · CSVView →
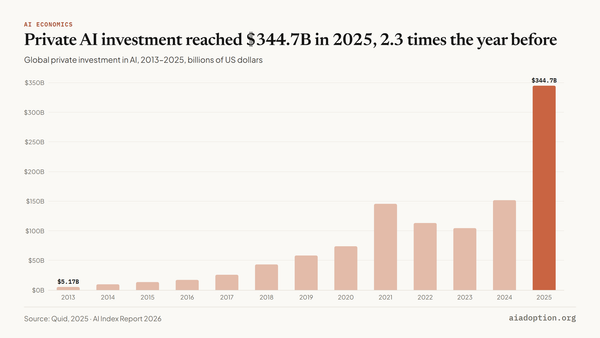 AI Investment Trends$344.7BGlobal private investment in AI in 2025, up from $151.5B in 2024Private AI investment reached $344.7B in 2025, 2.3 times the year beforeChart · CSVView →
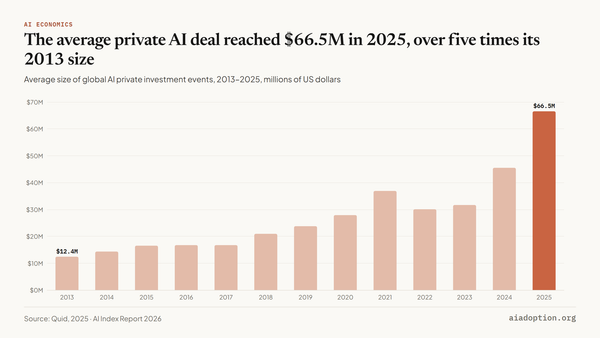 AI Investment Trends$66.5MAverage AI private investment event in 2025, up 46% from $45.5M in 2024The average private AI deal reached $66.5M in 2025, over five times its 2013 sizeChart · CSVView →
02
Generative AI Investment
Private investment in generative AI reached $170.9B in 2025, 3.4 times the $50.6B of 2024 and about half of all private AI investment. US companies took $163.6B of it, 96%. Yet the number of newly funded generative AI companies fell to 311 from 372, the first fall in the series.
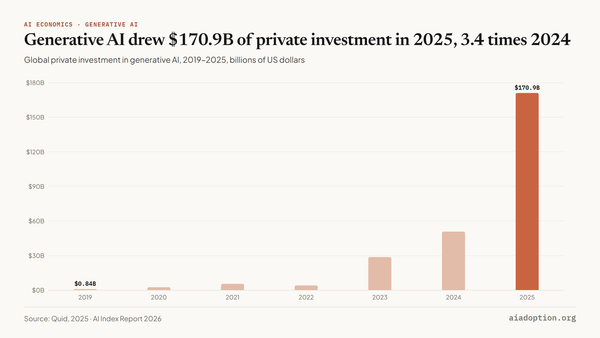 Generative AI Investment$170.9BPrivate investment in generative AI in 2025, up from $50.6B in 2024Generative AI drew $170.9B of private investment in 2025, 3.4 times 2024Chart · CSVView →
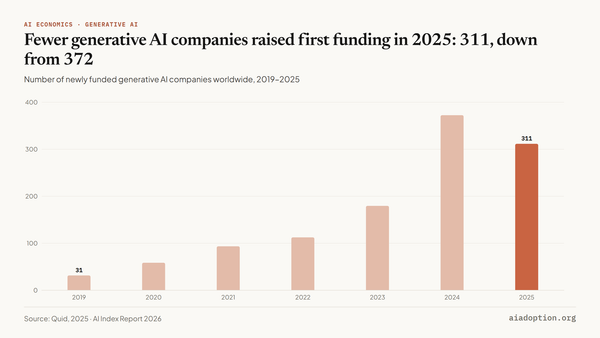 Generative AI Investment311Newly funded generative AI companies in 2025, down 16% from 372 in 2024Fewer generative AI companies raised first funding in 2025: 311, down from 372Chart · CSVView →
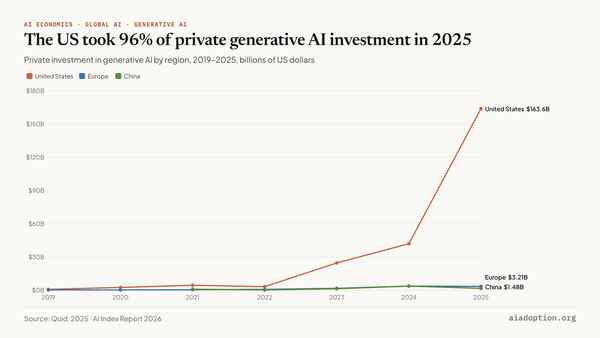 Generative AI Investment96%US share of global private generative AI investment in 2025 ($163.6B of $170.9B)The US took 96% of private generative AI investment in 2025Chart · CSVView →
03
AI Startups
3,499 AI companies raised their first funding in 2025, up 71% from 2,049 in 2024 and the highest count since at least 2013. US companies accounted for 1,953 of them, up 82%, against 639 in Europe and 161 in China. Since 2013, 8,909 newly funded AI companies have been US-based.
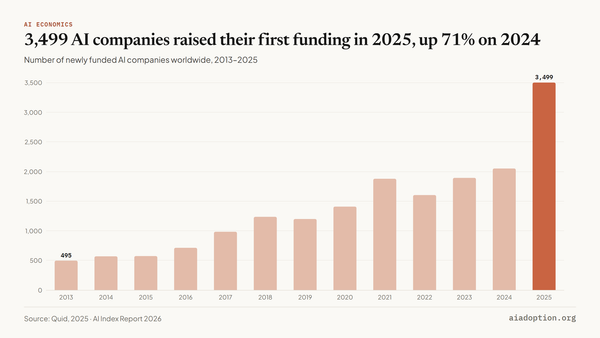 AI Startups3,499Newly funded AI companies worldwide in 2025, up from 2,049 in 20243,499 AI companies raised their first funding in 2025, up 71% on 2024Chart · CSVView →
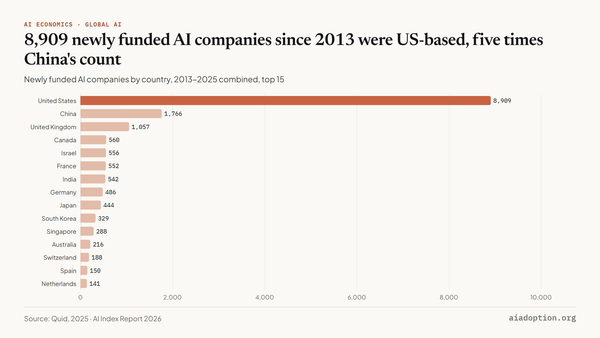 AI Startups8,909Newly funded US AI companies, 2013–2025 (China: 1,766; UK: 1,057)8,909 newly funded AI companies since 2013 were US-based, five times China's countChart · CSVView →
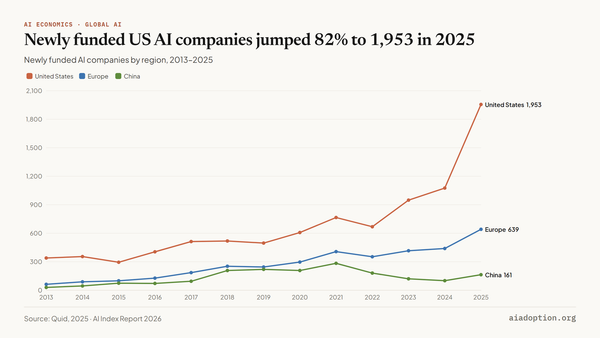 AI Startups1,953Newly funded US AI companies in 2025, up from 1,073 in 2024Newly funded US AI companies jumped 82% to 1,953 in 2025Chart · CSVView →
04
AI Investment by Country
US private AI investment reached $285.9B in 2025, 23 times China's $12.4B, with the UK third at $5.9B. The US–China gap widened from about $100 billion in 2024 to $273.5B, and cumulative US private AI investment since 2013 totals $757.3B, 5.7 times China's $131.8B.
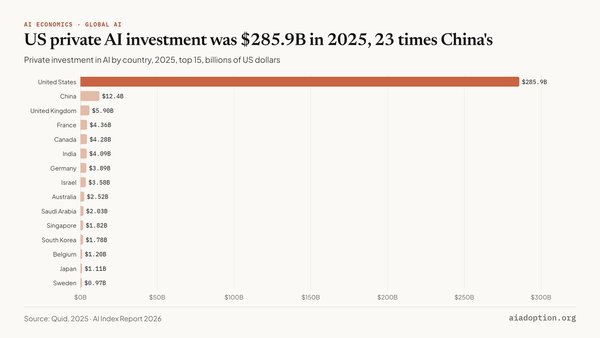 AI Investment by Country23×US private AI investment ($285.9B) relative to China's ($12.4B) in 2025US private AI investment was $285.9B in 2025, 23 times China'sChart · CSVView →
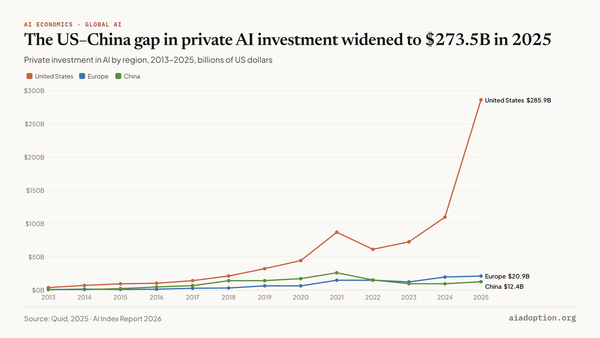 AI Investment by Country$273.5BGap between US ($285.9B) and Chinese ($12.4B) private AI investment in 2025The US–China gap in private AI investment widened to $273.5B in 2025Chart · CSVView →
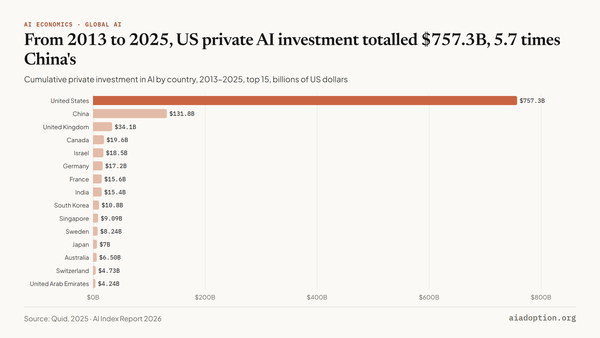 AI Investment by Country$757.3BCumulative US private AI investment, 2013–2025 (China: $131.8B)From 2013 to 2025, US private AI investment totalled $757.3B, 5.7 times China'sChart · CSVView →
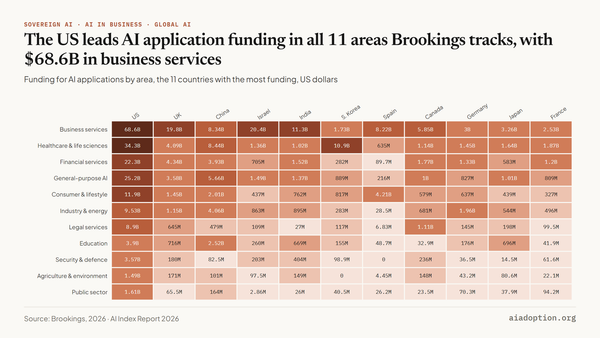 AI Investment by Country$68.6BUS funding for AI applications in business and enterprise services, the largest amount in any area and countryThe US leads AI application funding in all 11 areas Brookings tracks, with $68.6B in business servicesChart · CSVView →
05
AI Investment by US State
California-based AI companies received $218.5B of private investment in 2025, 77% of the $285.0B tracked across US states. Colorado was a distant second at $19.1B and New York third at $13.1B, followed by Florida ($6.3B) and Massachusetts ($4.8B). The totals count private investment by where each company is based.
06
AI Investment by Sector
Private investment in AI infrastructure, foundation models, research and governance reached $143.2B in 2025, up from $37.3B in 2024 and 4.5 times the next focus area, data management and processing ($31.6B). Across 25 focus areas since 2018, no other area has drawn funding on that scale in a single year.
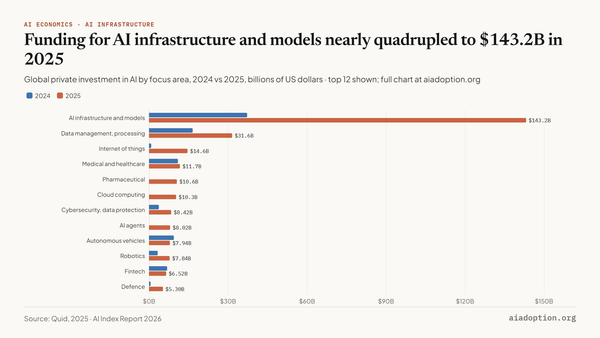 AI Investment by Sector$143.2BPrivate investment in AI infrastructure, models, research and governance in 2025, up from $37.3BFunding for AI infrastructure and models nearly quadrupled to $143.2B in 2025Chart · CSVView →
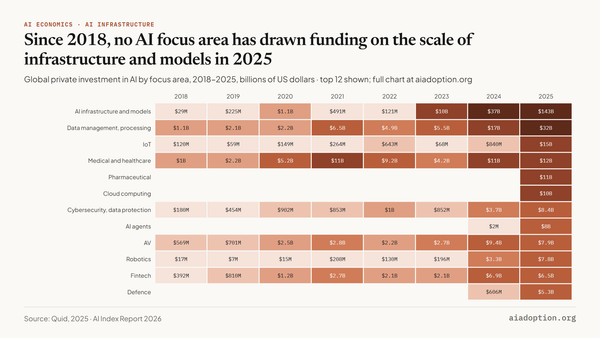 AI Investment by Sector$143.2BInfrastructure, models, research and governance in 2025, 4.5 times data management ($31.6B)Since 2018, no AI focus area has drawn funding on the scale of infrastructure and models in 2025Chart · CSVView →
07
AI Company Revenue
Epoch AI estimates Anthropic's annualised revenue at $65B at the end of July 2026 and OpenAI's at $50B at the end of September 2026. Spending is rising too: OpenAI's reported compute spend reached $16.3B in 2025, 2.8 times 2024, and Anthropic's $6.8B, up from $2.5B.
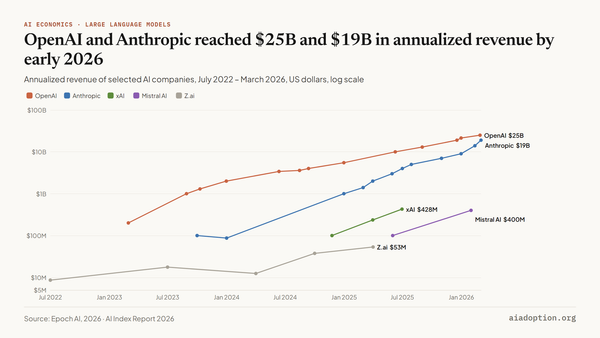 AI Company Revenue$65BAnthropic annualized revenue, end of July 2026 (OpenAI: $50B, end of September 2026)Anthropic's annualized revenue reached $65B by July 2026; OpenAI's reached $50B by SeptemberChart · CSVView →
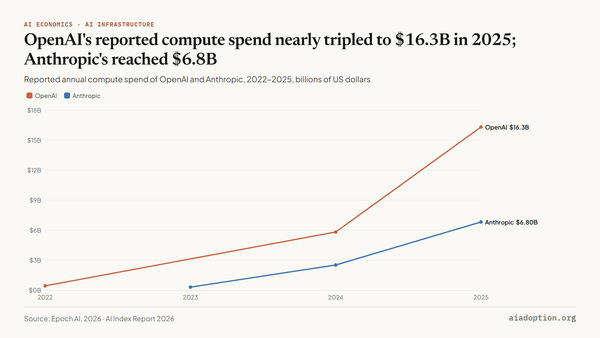 AI Company Revenue$16.3BOpenAI's reported compute spend in 2025, up from $5.8B in 2024OpenAI's reported compute spend nearly tripled to $16.3B in 2025; Anthropic's reached $6.8BChart · CSVView →
Related hubs
All 13 hubs →About the data: 18 interactive charts from the AI Index Report 2026 (Stanford HAI), using data from Quid, Brookings and Epoch AI. Each chart page explains what the chart shows, lists its key numbers, cites its source and links to the data as a CSV.