AI Ethics & Safety
How AI's harms and safeguards are measured: reported AI incidents, hallucination rates, how companies govern AI, national action on bias, privacy and diversity, and responsible AI research.
Governance & Responsibility · 24 charts · 6 topics
- Source
- Stanford AI Index Report 2026
- Charts
- 24 with CSV data
- Last checked
- 20 Oct 2026
- Data
- All CSVs (zip)
362AI incidents recorded by the AI Incident Database in 2025, up from 281 in 2024View chart →18%Organisations rating their AI incident response excellent in 2025, down from 28%View chart →22%Lowest hallucination rate of 26 models on AA-Omniscience (Grok 4.20 Beta)View chart →11%Organisations with no responsible AI policies in 2025, down from 24% in 2024View chart →59 of 138Countries scoring zero on GIRAI's AI bias and unfair discrimination measureView chart →1,521Responsible AI papers accepted at six major AI conferences in 2025, up 19%View chart →
Recorded AI harms are rising. The AI Incident Database recorded 362 incidents in 2025 in which AI systems caused or nearly caused harm, up 29% from 281 in 2024 and more than three times the 104 of 2022. The OECD's monitor, which collects incidents from news reports in many languages, counted 435 in January 2026, its highest month. Both count reported incidents, so they reflect how much is reported as well as how much happens.
Read the full overview
Companies report more incidents and less confidence in handling them. In the AI Index and McKinsey survey, 50% of organisations that had AI incidents reported three to five in 2025, up from 30% in 2024, and 18% rated their response excellent, down from 28%. Formal governance is spreading: the share of organisations with no responsible AI policies fell from 24% to 11%, and 74% saw inaccuracy as a relevant AI risk. Knowledge and training gaps were the obstacle named most often, by 59%.
Model behaviour varies widely. On Artificial Analysis's AA-Omniscience benchmark, hallucination rates across 26 models ran from 22% to 94%. At national level, the Global Index on Responsible AI (GIRAI) finds many countries with little formal action: 59 of 138 score zero on its bias and unfair discrimination measure, while the United States scores highest at 90.8. Research is growing: six major AI conferences accepted 1,521 responsible AI papers in 2025, up 19%, and authors in China had 812 of them.
The charts cover AI incidents, AI hallucination rates, AI governance in companies, AI bias and fairness by country, AI privacy and data protection, and responsible AI research. They come from Stanford's AI Index Report 2026, which draws on the AI Incident Database, the OECD AI Incidents and Hazards Monitor, Vectara, Artificial Analysis, a survey by the AI Index and McKinsey & Company, the University of Melbourne and KPMG, and GIRAI. The company survey has no respondents from China, and GIRAI measures national laws, oversight and civil society activity, not how AI models behave; its expert survey ran from late 2023 to early 2024.
AI Adoption · 2026AI Statistics: the pocket guide83Free for subscribersAll 83 key numbers on two pages, with sources.Every hub's headline numbers in one PDF, ready for a board paper or a slide.Get the guide
01
AI Incidents
The AI Incident Database recorded 362 AI incidents in 2025, up 29% from 281 in 2024 and the highest yearly count in the series. The OECD's monitor, which gathers incidents from news in many languages, counted 435 in January 2026 alone, its highest month and 2.3 times January 2025.
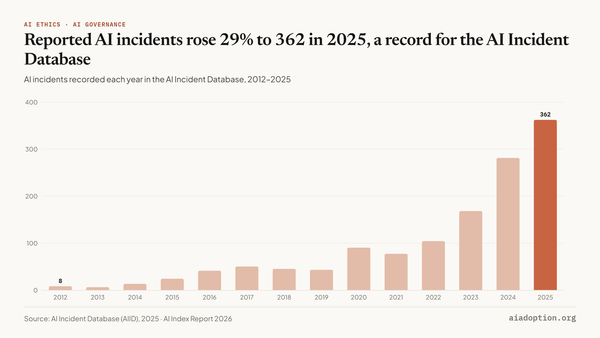 AI Incidents362AI incidents reported to the AI Incident Database in 2025, up from 281 in 2024Reported AI incidents rose 29% to 362 in 2025, a record for the AI Incident DatabaseChart · CSVView →
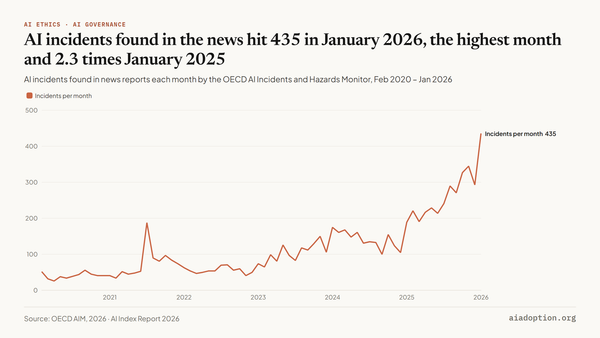 AI Incidents435AI incidents found in news reports in January 2026, up from 188 in January 2025AI incidents found in the news hit 435 in January 2026, the highest month and 2.3 times January 2025Chart · CSVView →
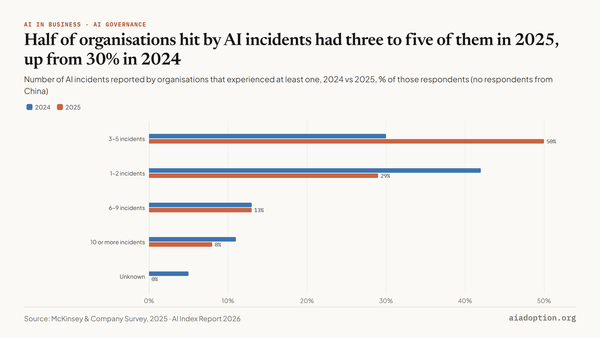 AI Incidents50%Of organisations that had AI incidents reported three to five of them in 2025, up from 30% in 2024Half of organisations hit by AI incidents had three to five of them in 2025, up from 30% in 2024Chart · CSVView →
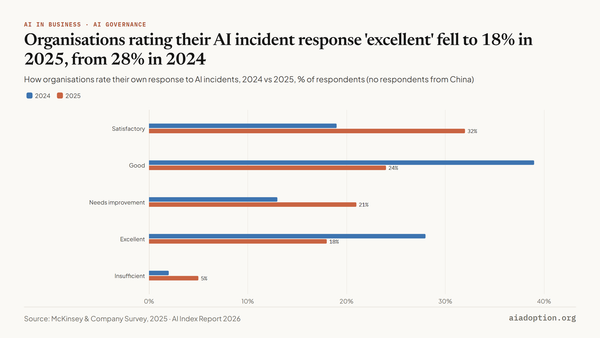 AI Incidents18%Of organisations rated their response to AI incidents excellent in 2025, down from 28% in 2024Organisations rating their AI incident response 'excellent' fell to 18% in 2025, from 28% in 2024Chart · CSVView →
02
AI Hallucination Rates
Hallucination rates across 26 models on Artificial Analysis's AA-Omniscience benchmark ran from 22% for Grok 4.20 Beta to 94% for gpt-oss-20B, with 15 models at 82% or above. On Vectara's document summary test, which uses a different scale, the lowest of 15 models was Finix S1 32B at 1.8%.
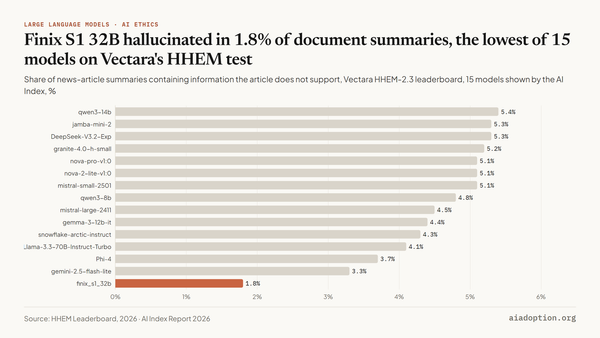 AI Hallucination Rates1.8%Hallucination rate of Ant Group's Finix S1 32B on Vectara's summary test, the lowest of the 15 models shown; Qwen3-14B: 5.4%Finix S1 32B hallucinated in 1.8% of document summaries, the lowest of 15 models on Vectara's HHEM testChart · CSVView →
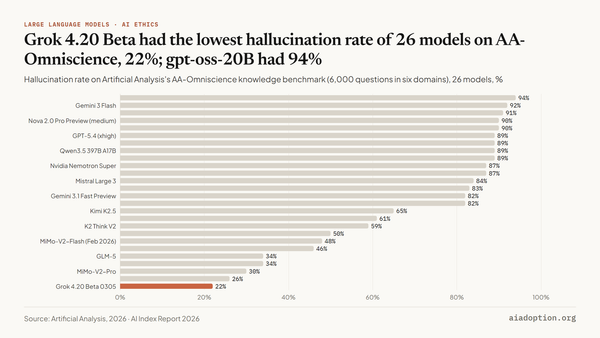 AI Hallucination Rates22%Hallucination rate of Grok 4.20 Beta 0305 on AA-Omniscience, the lowest of 26 models; Claude 4.5 Haiku 26%, MiMo-V2-Pro 30%Grok 4.20 Beta had the lowest hallucination rate of 26 models on AA-Omniscience, 22%; gpt-oss-20B had 94%Chart · CSVView →
03
AI Governance in Companies
The share of organisations with no responsible AI policies fell from 24% in 2024 to 11% in 2025, according to the AI Index and McKinsey survey. Average responsible AI maturity rose in all four regions surveyed, yet knowledge and training gaps remain the obstacle named most often, by 59% of organisations.
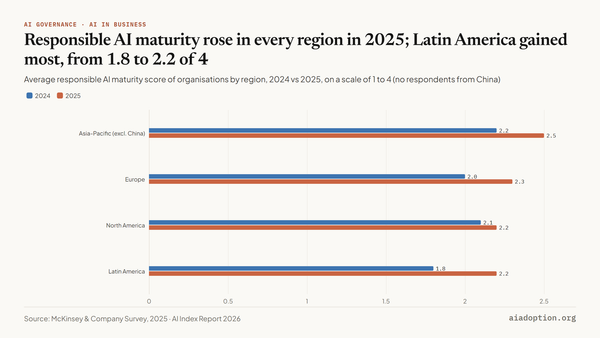 AI Governance in Companies2.2Latin America's average responsible AI maturity score in 2025, up from 1.8 in 2024, the largest gain of four regionsResponsible AI maturity rose in every region in 2025; Latin America gained most, from 1.8 to 2.2 of 4Chart · CSVView →
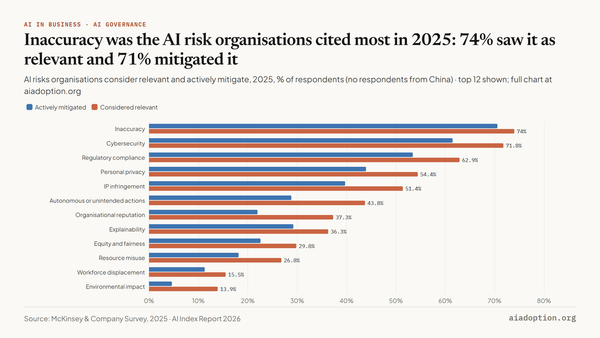 AI Governance in Companies74%Of organisations considered inaccuracy a relevant AI risk in 2025, up from 60% in 2024; 71% were actively mitigating itInaccuracy was the AI risk organisations cited most in 2025: 74% saw it as relevant and 71% mitigated itChart · CSVView →
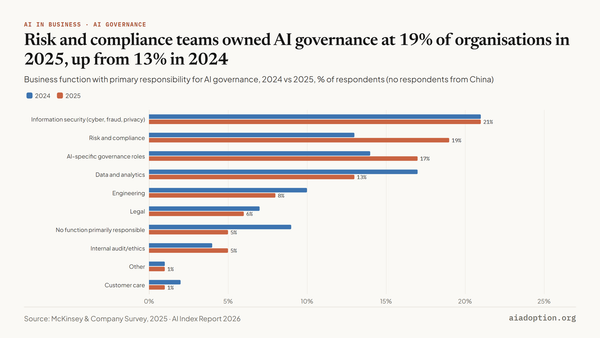 AI Governance in Companies19%Of organisations gave risk and compliance primary responsibility for AI governance in 2025, up from 13%; information security remained most common at 21%Risk and compliance teams owned AI governance at 19% of organisations in 2025, up from 13% in 2024Chart · CSVView →
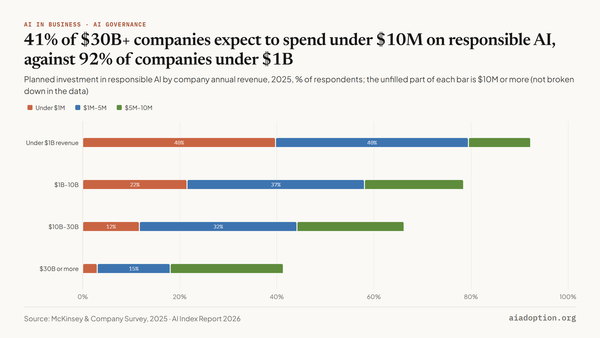 AI Governance in Companies41%Of companies with $30B or more in revenue expect to invest under $10M in responsible AI; among companies under $1B it is 92%41% of $30B+ companies expect to spend under $10M on responsible AI, against 92% of companies under $1BChart · CSVView →
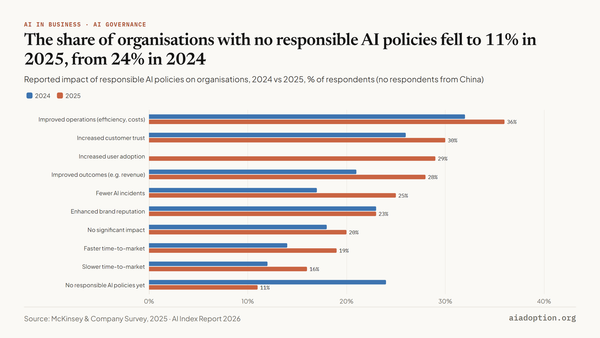 AI Governance in Companies11%Of organisations had not implemented responsible AI policies in 2025, down from 24% in 2024The share of organisations with no responsible AI policies fell to 11% in 2025, from 24% in 2024Chart · CSVView →
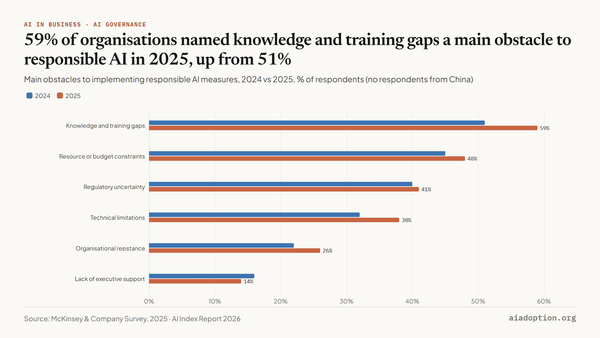 AI Governance in Companies59%Of organisations named knowledge and training gaps a main obstacle to implementing responsible AI in 2025, up from 51% in 202459% of organisations named knowledge and training gaps a main obstacle to responsible AI in 2025, up from 51%Chart · CSVView →
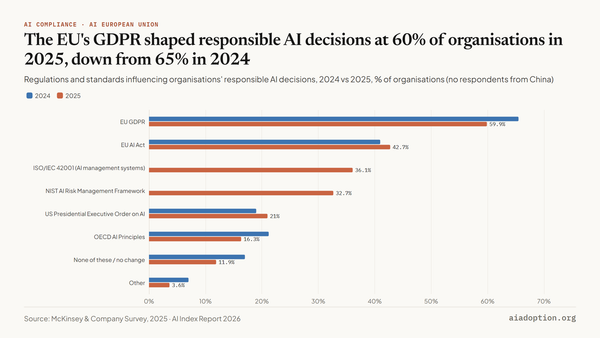 AI Governance in Companies60%Of organisations said the EU's GDPR influenced their responsible AI decisions in 2025, down from 65% in 2024; the EU AI Act: 43%The EU's GDPR shaped responsible AI decisions at 60% of organisations in 2025, down from 65% in 2024Chart · CSVView →
 AI Governance in Companies85%Share of employees in India agreeing their organisation supports responsible AI governance, 2025, the highest of 47 countries; United States 57%85% of employees in India say their organisation supports responsible AI governance; in Portugal, 40.5%Chart · CSVView →
04
AI Bias & Fairness by Country
The United States scores highest on the Global Index on Responsible AI's measure of national action against AI bias and discrimination, at 90.8 out of 100, while 59 of 138 countries score zero. On gender equality, Canada leads at 96.0 and only eight countries score 50 or more; the United States scores 43.1.
 AI Bias & Fairness by Country90.8The US score for measures against AI bias and unfair discrimination, the highest of 138 countries; Canada 85.7The US scores highest on GIRAI's AI bias and discrimination measure at 90.8; 59 of 138 countries score zeroChart · CSVView →
 AI Bias & Fairness by Country96.0Canada's score for gender equality measures in AI, the highest of 138 countries; the Netherlands 84.5, Australia 83.5Canada scores 96.0 on GIRAI's AI gender equality measure, the highest of 138 countries; 59 score zeroChart · CSVView →
 AI Bias & Fairness by Country89.8Singapore's score for protecting cultural and linguistic diversity in AI, the highest of 138 countries; Germany 87.5Singapore leads GIRAI's cultural and linguistic diversity measure at 89.8; 60 of 138 countries score zeroChart · CSVView →
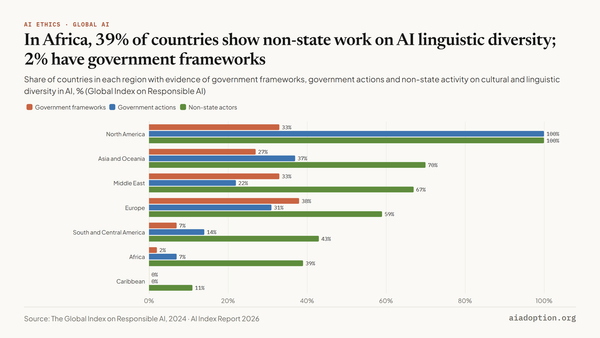 AI Bias & Fairness by Country39%Of African countries show non-state activity on cultural and linguistic diversity in AI; 7% show government actions and 2% government frameworksIn Africa, 39% of countries show non-state work on AI linguistic diversity; 2% have government frameworksChart · CSVView →
05
AI Privacy & Data Protection
The Netherlands scores highest on the Global Index on Responsible AI's data protection and privacy measure, at 97.3 out of 100, followed by Ireland (96.1) and Estonia (94.5). Of 138 countries, 68 score below 20 and 47 score zero; Australia and Uruguay are the only countries outside Europe in the top 10.

06
Responsible AI Research
Six major AI conferences accepted 1,521 responsible AI papers in 2025, up 19% from 1,278 in 2024 and 4.6 times the 329 of 2019. Authors in China had 812 of them, more than twice the 394 from the United States, though over 2019–2025 combined US authors lead with 3,865 papers.
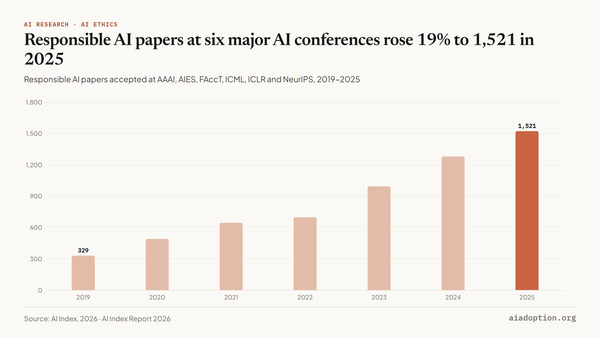 Responsible AI Research1,521Responsible AI papers accepted at six AI conferences in 2025, up from 1,278 in 2024Responsible AI papers at six major AI conferences rose 19% to 1,521 in 2025Chart · CSVView →
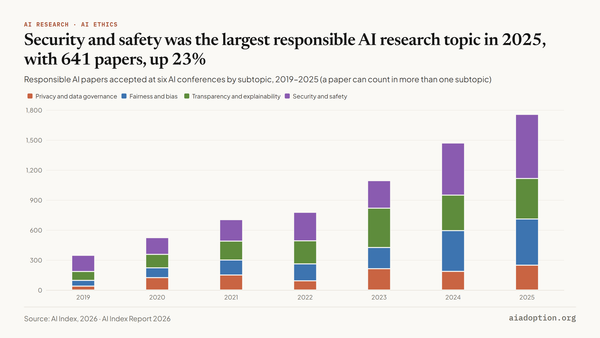 Responsible AI Research641Security and safety papers accepted at six AI conferences in 2025, up from 521 in 2024Security and safety was the largest responsible AI research topic in 2025, with 641 papers, up 23%Chart · CSVView →
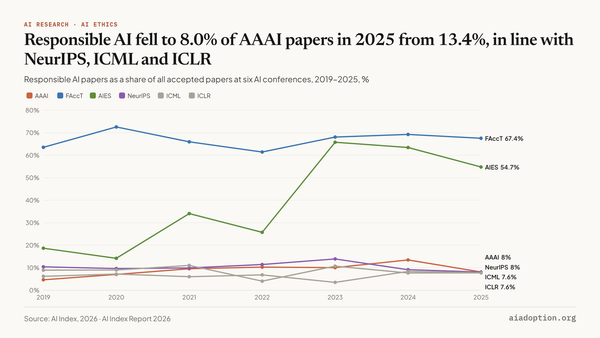 Responsible AI Research8.0%Share of AAAI's accepted papers on responsible AI in 2025, down from 13.4% in 2024Responsible AI fell to 8.0% of AAAI papers in 2025 from 13.4%, in line with NeurIPS, ICML and ICLRChart · CSVView →
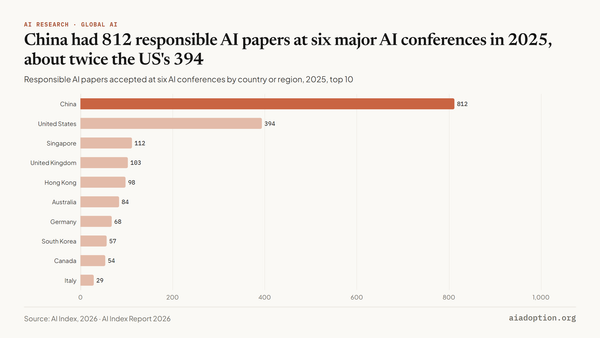 Responsible AI Research812Responsible AI papers from China at six AI conferences in 2025, more than twice the US's 394China had 812 responsible AI papers at six major AI conferences in 2025, about twice the US's 394Chart · CSVView →
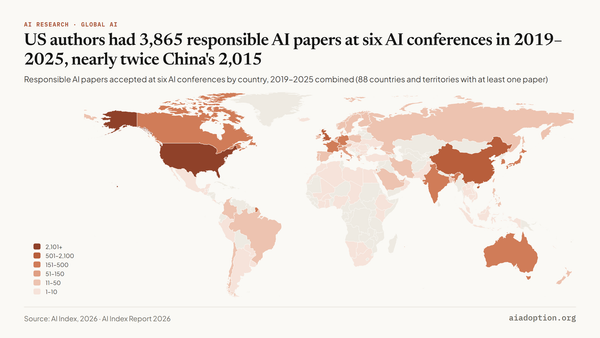 Responsible AI Research3,865Responsible AI papers from the US at six AI conferences, 2019–2025 combined; China 2,015, UK 646US authors had 3,865 responsible AI papers at six AI conferences in 2019–2025, nearly twice China's 2,015Chart · CSVView →
Related hubs
All 13 hubs →About the data: 24 interactive charts from the AI Index Report 2026 (Stanford HAI), using data from research partners credited on each chart. Each chart page explains what the chart shows, lists its key numbers, cites its source and links to the data as a CSV.