Robots & Self-Driving Cars
Charts on robots and self-driving cars, from robotaxi rides and crash records to factory and service robot installations. Waymo's paid trips in California reached about 283,900 a week in December 2025.
Infrastructure & Industry · 15 charts · 5 topics
- Source
- Stanford AI Index Report 2026
- Charts
- 15 with CSV data
- Last checked
- 20 Oct 2026
- Data
- All CSVs (zip)
283,900Weekly paid Waymo robotaxi trips in California, December 2025View chart →11MEstimated fully driverless rides on Baidu's Apollo Go in 2025, up from 4 millionView chart →94Waymo crashes with any injury to September 2025; human-driven benchmark: 501View chart →12.4%Household tasks fully completed by the top team in the 2025 BEHAVIOR ChallengeView chart →542,000Industrial robots installed worldwide in 2024, against 541,000 in 2023View chart →54.4%China's share of the 542,000 industrial robots installed worldwide in 2024View chart →
Robots and self-driving cars are where AI operates in the physical world, and robotaxi services grew quickly in 2025. Waymo's paid driverless trips in California reached about 283,900 a week in December 2025, 2.3 times a year earlier, and Baidu's Apollo Go gave an estimated 11 million fully driverless rides in 2025, up from 4 million in 2024. On Waymo's own figures, its driverless cars had 94 crashes with any injury through September 2025, against 501 for a human-driven benchmark over the same miles and areas.
Read the full overview
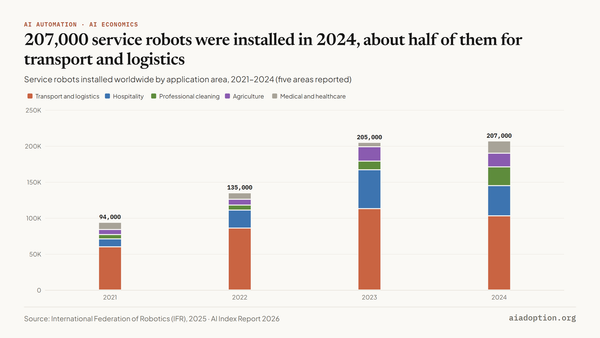
Factory robots are a larger and older market. The International Federation of Robotics counted 542,000 industrial robot installations worldwide in 2024, level with 2023 and below the 2022 peak of 553,000, and 4.66 million industrial robots in operation. China installed 295,000, 54.4% of the world total, while installations fell in five of the 10 largest markets, including the US (−9%). Collaborative robots, built to work alongside people, made up 12.0% of installations, and 207,000 service robots were installed, about half for transport and logistics.
Research benchmarks show a gap between short simulated tasks and household work. The best method on RLBench's simulated manipulation tasks reached 89.4% average success in 2025, up from 49.4% in 2022, but the top team in the 2025 BEHAVIOR Challenge fully completed only 12.4% of household tasks. On ResponsibleRobotBench, which counts a task only if every safety condition is met, GPT-4o scored 0.64, the best of five models.
The charts cover robotaxis, self-driving car safety, robotics benchmarks, industrial robots and service robots. The figures come from Stanford's AI Index Report 2026 and the data it draws on, including the California Public Utilities Commission, Baidu, Waymo, the International Federation of Robotics and published benchmark results. Waymo's safety figures are its own, comparable ridership for European operators is not public, and installation counts measure new robots in a year, not robots in use.
AI Adoption · 2026AI Statistics: the pocket guide83Free for subscribersAll 83 key numbers on two pages, with sources.Every hub's headline numbers in one PDF, ready for a board paper or a slide.Get the guide
01
Robotaxis
Waymo's paid driverless trips in California reached about 283,900 a week in December 2025, 2.3 times the 122,200 of December 2024, as reported to the California Public Utilities Commission. In China, Baidu's Apollo Go gave an estimated 11 million fully driverless rides in 2025, up 175% from 4 million in 2024.
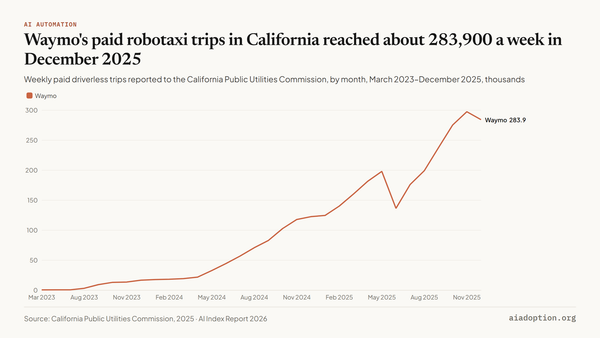 Robotaxis283.9Thousand weekly paid Waymo trips in California, December 2025Waymo's paid robotaxi trips in California reached about 283,900 a week in December 2025Chart · CSVView →
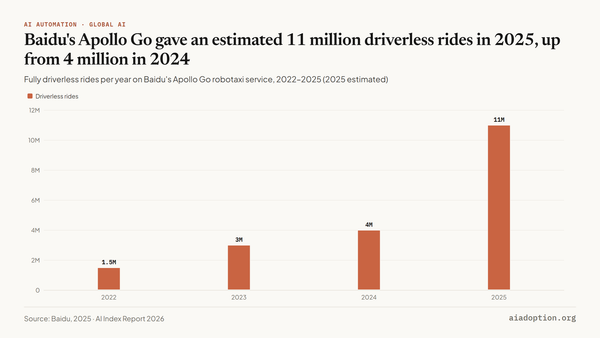 Robotaxis11MEstimated driverless rides on Apollo Go in 2025, up from 4 million in 2024Baidu's Apollo Go gave an estimated 11 million driverless rides in 2025, up from 4 million in 2024Chart · CSVView →
02
Self-Driving Car Safety
Through September 2025, Waymo's driverless cars reported 94 crashes with any injury, against 501 for a human-driven benchmark over the same miles and areas, about 81% fewer. The largest gap is at intersections, 8 against 198. Crashes with airbag deployment show a similar pattern, 39 against about 182; all figures are Waymo's own.
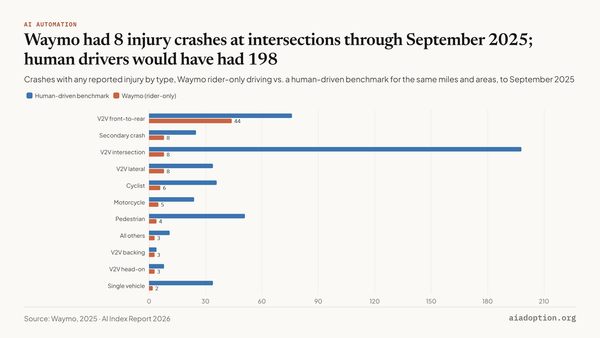 Self-Driving Car Safety8Vehicle-to-vehicle intersection crashes with an injury for Waymo, against 198 for the human-driven benchmarkWaymo had 8 injury crashes at intersections through September 2025; human drivers would have had 198Chart · CSVView →
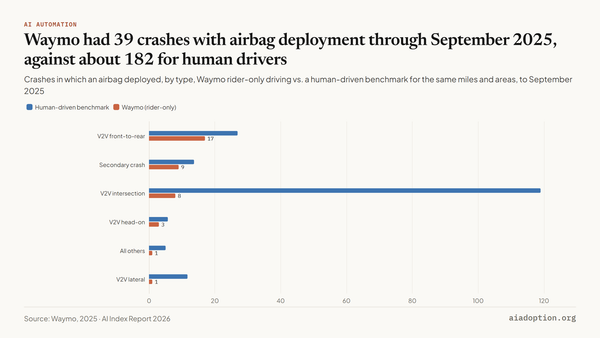 Self-Driving Car Safety39Crashes with airbag deployment for Waymo through September 2025, against about 182 for the human-driven benchmarkWaymo had 39 crashes with airbag deployment through September 2025, against about 182 for human driversChart · CSVView →
03
Robotics Benchmarks
The best robot-manipulation method on RLBench reached 89.4% average success in 2025, up from 49.4% in 2022, but these are short tasks in a controlled simulation. On BEHAVIOR-1K's 1,000 household activities, the top team in the 2025 challenge fully completed 12.4% of held-out tasks and scored 26% with partial credit.
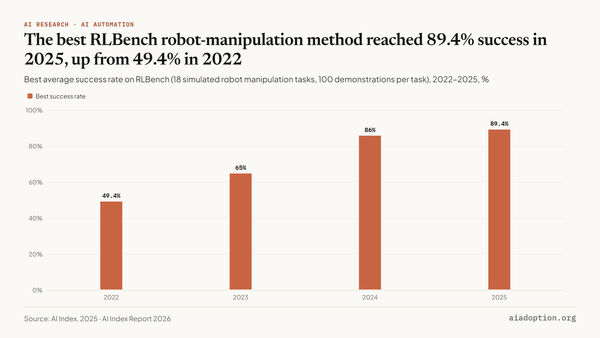 Robotics Benchmarks89.4%Average RLBench success rate of EquAct, the best method in 2025, up from 49.4% for PerAct in 2022The best RLBench robot-manipulation method reached 89.4% success in 2025, up from 49.4% in 2022Chart · CSVView →
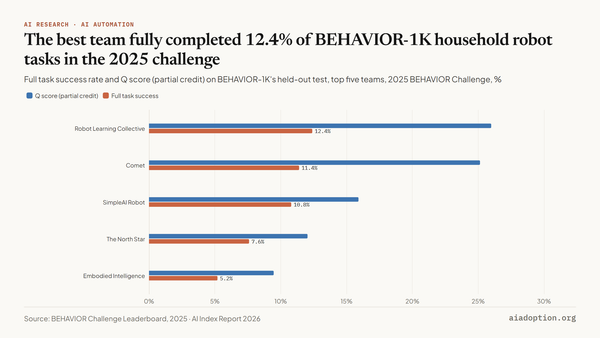 Robotics Benchmarks12.4%Full task success rate of Robot Learning Collective, the top team; its partial-credit Q score was 26%The best team fully completed 12.4% of BEHAVIOR-1K household robot tasks in the 2025 challengeChart · CSVView →
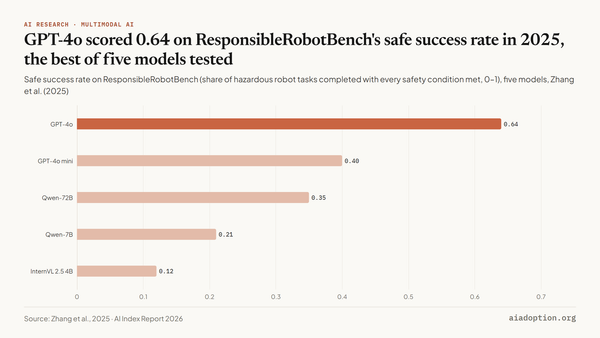 Robotics Benchmarks0.64Safe success rate of GPT-4o, the best of five models; the best open-source model, Qwen-72B, scored 0.35GPT-4o scored 0.64 on ResponsibleRobotBench's safe success rate in 2025, the best of five models testedChart · CSVView →
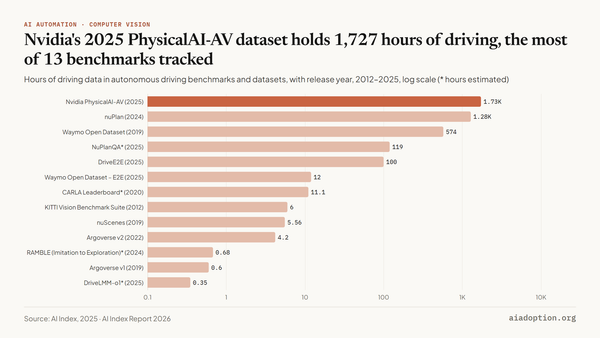 Robotics Benchmarks1,727 hoursOf driving data in Nvidia's PhysicalAI-AV dataset (2025), the largest of the 13 tracked; nuPlan (2024) has 1,282Nvidia's 2025 PhysicalAI-AV dataset holds 1,727 hours of driving, the most of 13 benchmarks trackedChart · CSVView →
04
Industrial Robots
542,000 industrial robots were installed worldwide in 2024, level with 541,000 in 2023 and below the 2022 peak of 553,000, while the operational stock rose 8.9% to 4.66 million. China installed 295,000, 54.4% of the world total and 6.6 times Japan; US installations fell 9%.
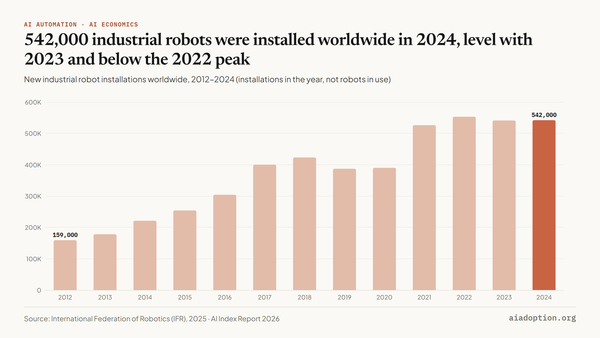 Industrial Robots542,000Industrial robots installed worldwide in 2024, against 541,000 in 2023 and 553,000 in 2022542,000 industrial robots were installed worldwide in 2024, level with 2023 and below the 2022 peakChart · CSVView →
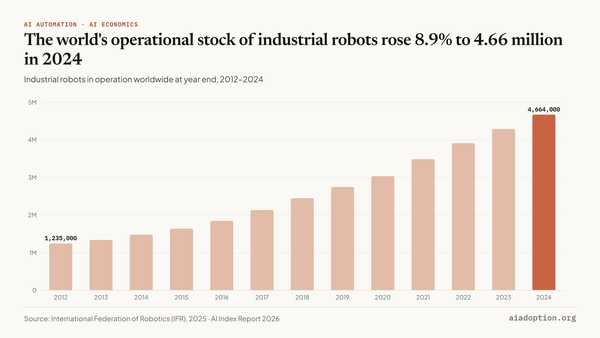 Industrial Robots4.66MIndustrial robots in operation worldwide in 2024, up from 4.28 million in 2023The world's operational stock of industrial robots rose 8.9% to 4.66 million in 2024Chart · CSVView →
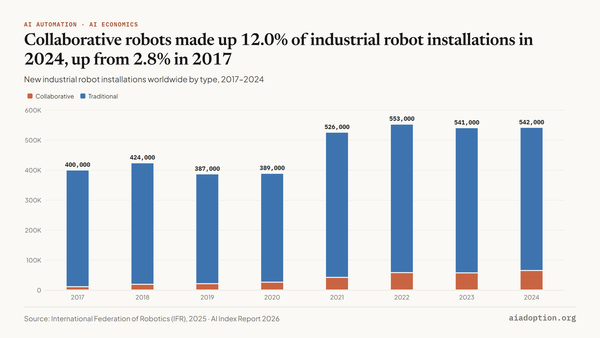 Industrial Robots12.0%Collaborative robots' share of industrial robot installations worldwide in 2024 (65,000 of 542,000)Collaborative robots made up 12.0% of industrial robot installations in 2024, up from 2.8% in 2017Chart · CSVView →
 Industrial Robots54.4%China's share of the 542,000 industrial robots installed worldwide in 2024China installed 295,000 industrial robots in 2024, 54.4% of the world total and 6.6 times JapanChart · CSVView →
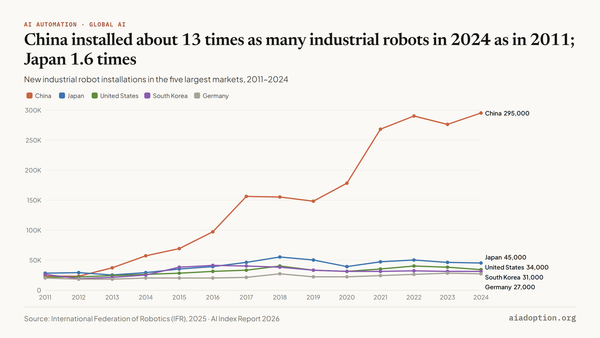 Industrial Robots295,000Industrial robots installed in China in 2024, up from 23,000 in 2011China installed about 13 times as many industrial robots in 2024 as in 2011; Japan 1.6 timesChart · CSVView →
 Industrial Robots−9%Change in US industrial robot installations from 2023 to 2024; Taiwan +33%, Italy −16%Industrial robot installations fell in 2024 in five of the 10 largest markets, including the US (−9%)Chart · CSVView →
05
Service Robots
207,000 service robots were installed worldwide in 2024 across the five application areas the IFR reports, up from 205,000 in 2023 and more than twice the 94,000 of 2021. Transport and logistics made up 103,000, about half, while professional cleaning and medical and healthcare robots grew most.
Related hubs
All 13 hubs →About the data: 15 interactive charts from the AI Index Report 2026 (Stanford HAI), using data from research partners credited on each chart. Each chart page explains what the chart shows, lists its key numbers, cites its source and links to the data as a CSV.