295,000
▲ 13× since 2011
industrial robots installed in China in 2024
20112024
What the chart shows
Among the five largest markets, China’s annual installations rose from 23,000 in 2011 to 295,000 in 2024, about 13 times as many. China overtook Japan in 2013 and has installed the most robots every year since.
The other four grew far less: Japan from 28,000 to 45,000, the United States from 21,000 to 34,000, South Korea from 26,000 to 31,000 and Germany from 20,000 to 27,000. Japan, the US and Germany installed fewer robots in 2024 than in 2023.
Key numbers
| Measure | Value |
|---|---|
| China, 2024 | 295,000 |
| China, 2011 | 23,000 |
| Japan, 2024 | 45,000 |
| United States, 2024 | 34,000 |
| South Korea, 2024 | 31,000 |
| Germany, 2024 | 27,000 |
How to read it
- Values are rounded to the nearest thousand; the 2024 country chart gives Japan 44,500 and the US 34,200.
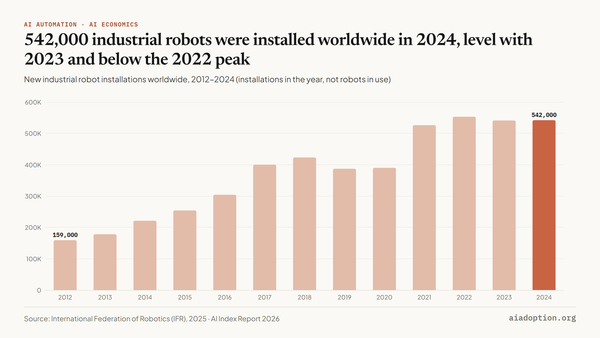
- The AI Index puts China’s share of world installations at 20.8% in 2013 and 54.4% in 2024, using the world totals in the installations chart.
Source: International Federation of Robotics (IFR), 2025, via the AI Index Report 2026 (Stanford HAI), figure 4.5.5: Number of new industrial robots installed in top 5 countries, 2011–24. Chart and text by AI Adoption.
Numbers checked against the published data on 20 October 2026.
Download the data (CSV) · Cite this chart
Numbers checked against the published data on 20 October 2026.
Download the data (CSV) · Cite this chart


Discussion