−9%
change in US industrial robot installations from 2023 to 2024; Taiwan +33%, Italy −16%
What the chart shows
Installations fell in 2024 in half of the ten largest markets for industrial robots. Italy had the steepest drop, 16%, followed by the United States (9%), Germany (5%), Japan (4%) and South Korea (3%).
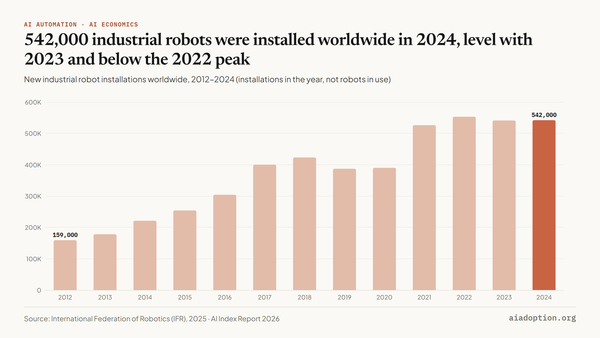
Taiwan grew fastest, by 33%, from a much smaller base than China. China and India each grew 7%, Mexico 4% and Spain 1%. Worldwide, installations were up 0.2% (related chart).
Key numbers
| Measure | Value |
|---|---|
| Taiwan | +33% |
| China | +7% |
| India | +7% |
| United States | −9% |
| Italy | −16% |
How to read it
- Year-on-year change in new installations, 2023 to 2024, for the 10 largest markets in 2024. The data file rounds growth to whole percentages.
- A large percentage change can come from a small base: Taiwan installed 5,800 robots in 2024, against China’s 295,000 (country chart).
Source: International Federation of Robotics (IFR), 2025, via the AI Index Report 2026 (Stanford HAI), figure 4.5.6: Annual growth rate of industrial robots installed by geographic area, 2023 vs. 2024. Chart and text by AI Adoption.
Numbers checked against the published data on 20 October 2026.
Download the data (CSV) · Cite this chart
Numbers checked against the published data on 20 October 2026.
Download the data (CSV) · Cite this chart


Discussion