59%
▲ 6.9 pts since 2022
Share of adults saying AI products and services have more benefits than drawbacks, Ipsos global average, 2025
20222025
What the chart shows
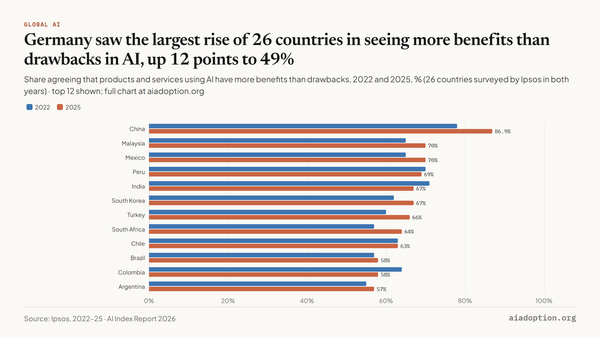
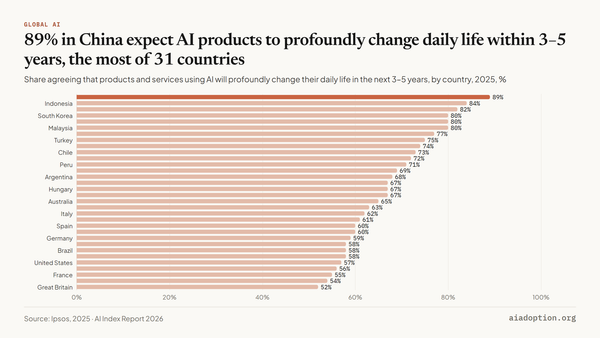
Ipsos’s AI Monitor asks adults whether they agree with statements about products and services that use AI. On Ipsos’s global country average, 59% agreed in 2025 that they have more benefits than drawbacks, up from 52% in 2022 and 55% in 2024. Two in three (67%) expect AI to profoundly change their daily life in the next three to five years.
Optimism and unease are rising together. The share saying AI products make them nervous rose from 39% in 2022 to 52% in 2025, while the share saying they make them excited has stayed at 53–54% since 2023. In 2025, 79% agreed that products using AI should have to disclose it.
Key numbers
| Measure | Value |
|---|---|
| More benefits than drawbacks, 2022 | 52% |
| More benefits than drawbacks, 2025 | 58.9% |
| Make me nervous, 2022 | 39% |
| Make me nervous, 2025 | 52% |
| Will change my daily life in 3–5 years, 2025 | 67% |
| Should have to disclose AI use, 2025 | 79.3% |
How to read it
- Each line is Ipsos’s global country average of the share agreeing. The 2025 survey covered 23,216 adults in 30 countries (21 March–4 April); the set of countries changes from year to year, so changes partly reflect who was surveyed.
- Line labels are short forms of the statements: ‘Benefits > drawbacks’ is ‘have more benefits than drawbacks’ and ‘Will change daily life’ is ‘will profoundly change my daily life in the next 3–5 years’. “Make me excited” was first asked in 2023. The chart shows four of the 13 statements in the data file; the others, including disclosure and trust, are in the CSV.
- The AI Index’s country chart of year-on-year changes gives a 3-point rise in nervousness in 2025; this series shows 2 points (50% to 52%). The two use different averages; we report each file as published.
Source: Ipsos, 2022–25, via the AI Index Report 2026 (Stanford HAI), figure 9.1.1: Global opinions on products and services using AI (% of total), 2022–25. Chart and text by AI Adoption.
Numbers checked against the published data on 20 October 2026.
Download the data (CSV) · Cite this chart
Numbers checked against the published data on 20 October 2026.
Download the data (CSV) · Cite this chart


Discussion