0.48
#1 of 14
average Spearman correlation on ProteinGym for E1 with retrieval (600M parameters, 2025); ESM-2 with 3B parameters scored 0.41
What the chart shows
ProteinGym scores how well a model predicts the effects of mutations, as the correlation between its predictions and laboratory measurements across more than 250 assays. Profluent’s E1 with retrieval augmentation scored highest, 0.48 with 600 million parameters, ahead of PoET (0.47, 2023).
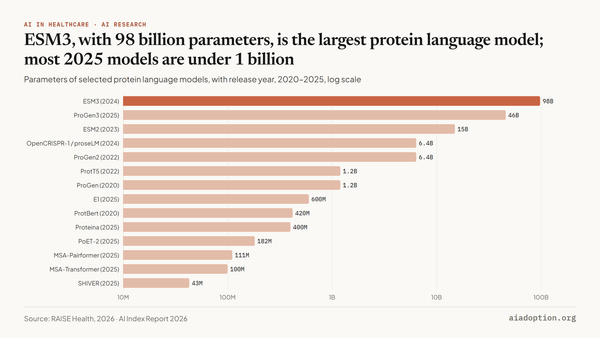
Size alone did not decide the ranking: the 3-billion-parameter ESM-2 scored 0.41, below the 111-million-parameter MSA Pairformer (0.45). Retrieval lifted each E1 model by 0.06 to 0.07.
Key numbers
| Measure | Value |
|---|---|
| E1 with retrieval (600M) | 0.477 |
| E1 with retrieval (300M) | 0.475 |
| PoET (200M) | 0.470 |
| MSA Pairformer (111M) | 0.450 |
| ESM-2 (3B) | 0.406 |
| ESM-2 (150M) | 0.387 |
How to read it
- Spearman correlation runs from −1 to 1; higher means a model ranks mutations closer to their measured effects.
- The AI Index text says MSA Pairformer surpassed previous state-of-the-art methods; in this data its 0.45 is below PoET (0.47) and the three E1 models with retrieval (0.47–0.48). We use the data.
- Several models appear in more than one size; each size is a separate bar.
Source: RAISE Health, 2026, via the AI Index Report 2026 (Stanford HAI), figure 6.1.6: Performance of protein language models on ProteinGym, 2021–25. Chart and text by AI Adoption.
Numbers checked against the published data on 20 October 2026.
Download the data (CSV) · Cite this chart
Numbers checked against the published data on 20 October 2026.
Download the data (CSV) · Cite this chart


Discussion